Feature Engineering: Could Spline solve your data fitting problems?
Discover how Splines outshine polynomials in handling complex trends
Picture this: You want to predict how long a customer will stay subscribed to your streaming service. (Totally realistic, right?) The likelihood of a customer leaving the service doesn’t decrease linearly as time goes by. Instead, it drops like a rock in the early days and then starts to level off as the customers settle in and start binging your shows (loyalty kicks in). 📉
Sounds familiar? No one likes their subscribers to leave — instead subscribe below 😉
Coming back to our main topic — Now, you need a curve to model this behavior. But which one should you choose? Should you go for a smooth polynomial curve, or should you go for something a bit more flexible—like a spline? Both options are popular in data science for modeling non-linear relationships, but they come with their quirks. Let’s see how these two shape up!
The Use Case: Predicting Customer Churn
In the beginning, churn is like a race: customers join, some leave right away if they don’t like the service (maybe they didn’t find the latest blockbuster as good as advertised!). But after a while, the people who stick around are more likely to stay put. They’ve already committed and are too deep into their watchlists. 📉
Our goal is to fit a curve that captures this trend. Our feature will be
x = time since the customer joinedand our target will be —
y = probability of churnNow comes the fun part: We’re going to model this relationship using polynomial functions and spline functions to see which fits better. 🎨
Polynomial Functions: The Overachiever
Let’s talk about polynomial functions. They’re smooth, continuous curves that go something like this:
Basically, it’s a bunch of terms with powers of x. The higher the degree, the more flexible the curve. 🎢
But there’s a catch: polynomials can be a bit too eager. Imagine that one friend who volunteers for everything at a party—decorations, games, food, music—only to make a mess of things. 🎉😅 Polynomials try to fit the data too well, even if it means fitting the noise. And that’s called overfitting.
Example: The Polynomial Model
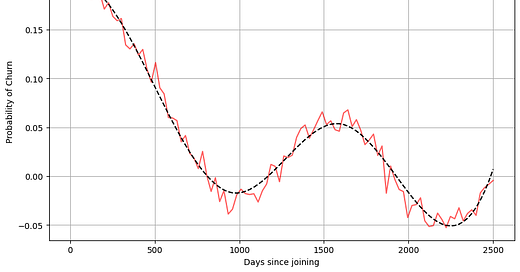
Picture a 4th-degree polynomial (because we like to go all out, don’t we?).
This is your polynomial, trying to fit everything. Sure, it’s smooth, but it’s also a little... too ambitious. 😅
It might fit the data really well in some places, but in other places, it wiggles too much—just like trying to cram a 5-layer cake into a 2-layer cake mold.
You end up with cake everywhere. Too much is not always better! 🎂😂
Spline Functions: A More Elegant Fit
Now, let’s take a deep breath and try something a little more refined: Spline functions. Think of splines as the flexible yoga instructor of modeling—they bend and flex where needed, but they’re not trying to be all things to all data points. 🧘♂️
A spline divides the data into segments and fits a different function to each segment, but ensures that the pieces connect smoothly. The most common type of spline is the cubic spline, which fits a cubic polynomial to each segment but ensures the segments match smoothly at their boundaries (no weird jumps or wiggles).
Here’s the magic of splines: they are much more flexible than a polynomial in fitting complex relationships, but they’re also more controlled. They focus on the important trends in the data, while ignoring the unnecessary noise.
Example: Spline Model
Let’s now model the same relationship with a spline and see how it fits:
Look at that spline—smooth, flexible, and oh-so-elegant. 💅
Notice how the spline fits the data much more gracefully. It follows the trend of the data without trying to chase every little bump. The model is less likely to overfit the data, especially the noisy parts, and focuses on capturing the overall pattern.
The Key Differences: Polynomial vs. Spline
Now that we’ve seen both models, let’s summarize the key differences between polynomial and spline functions:
Polynomials are a single curve that tries to fit the whole data in one go. While they are flexible, they can be prone to overfitting and may not handle abrupt changes well.
Splines, on the other hand, are a series of curves joined together, offering more local flexibility. They can handle complex data relationships better, while avoiding overfitting.
Conclusion: which one should you use?
If the relationship is simple and smooth—like a nice, easy downward trend—a polynomial could work well. No need to complicate things if the trend is straightforward. 🎯
But if the relationship is more complex, with sudden shifts or different behaviors over time—like customer churn, where early churn is high but levels out over time—splines are your best bet. They’re flexible without being over-the-top, and they know when to stop fitting the small stuff. 😎🌀
So next time you’re faced with a curveball of a dataset, try using splines and let them work their magic. 🌟
Until next time, happy modeling! 🧑💻💡


