

Production-ready RAG: Monitoring & Caching
Mother of AI Project, Phase 1: Week 6


Hey there 👋,
Welcome to lesson six of "The Mother of AI" - Zero to RAG series!
A production RAG system isn't just about getting answers, it's about understanding how it works, optimizing performance, and delivering consistent results at scale.
Weeks 1–5 gave us solid infrastructure, live data pipeline, BM25 keyword search, hybrid retrieval with semantic understanding, and complete LLM integration. Now we add the critical production components: observability with Langfuse and intelligent caching with Redis.
Most teams ship RAG without visibility into what's happening. We won't. We'll implement comprehensive tracing, performance monitoring, and intelligent caching that makes your RAG system production-ready.
Quick recap:
A production RAG system needs more than just functionality - it needs observability → monitoring → optimization → scale.
Weeks 1–5 gave us a complete RAG pipeline from data ingestion to answer generation.
Now we complete the production deployment with Langfuse tracing that shows exactly what's happening and Redis caching that delivers instant responses for common queries.
This week's goals
Integrate Langfuse for complete RAG observability and tracing
Implement Redis caching with intelligent key strategies
Add performance monitoring with latency tracking and cost analysis
Create semantic caching foundation for future enhancements
Deliverables
Langfuse integration with automatic trace collection and visualization
Multi-layer caching strategy with TTL management and invalidation
Performance dashboards showing latency, costs, and usage patterns
Production monitoring with alerts and health checks
Big picture: We took the complete RAG system from Week 5 and added production-grade monitoring and caching, creating a system that's not just functional but observable and optimized.
The key insight: Tracing every step from query to answer reveals bottlenecks, while intelligent caching eliminates redundant processing for 60%+ of queries.
The architecture now includes: Complete observability layer with Langfuse tracking retrieval quality and generation metrics, plus Redis caching that serves frequent queries instantly without hitting the LLM. Circuit breakers and advanced resilience patterns are planned for upcoming extensions.
What we built (high level)
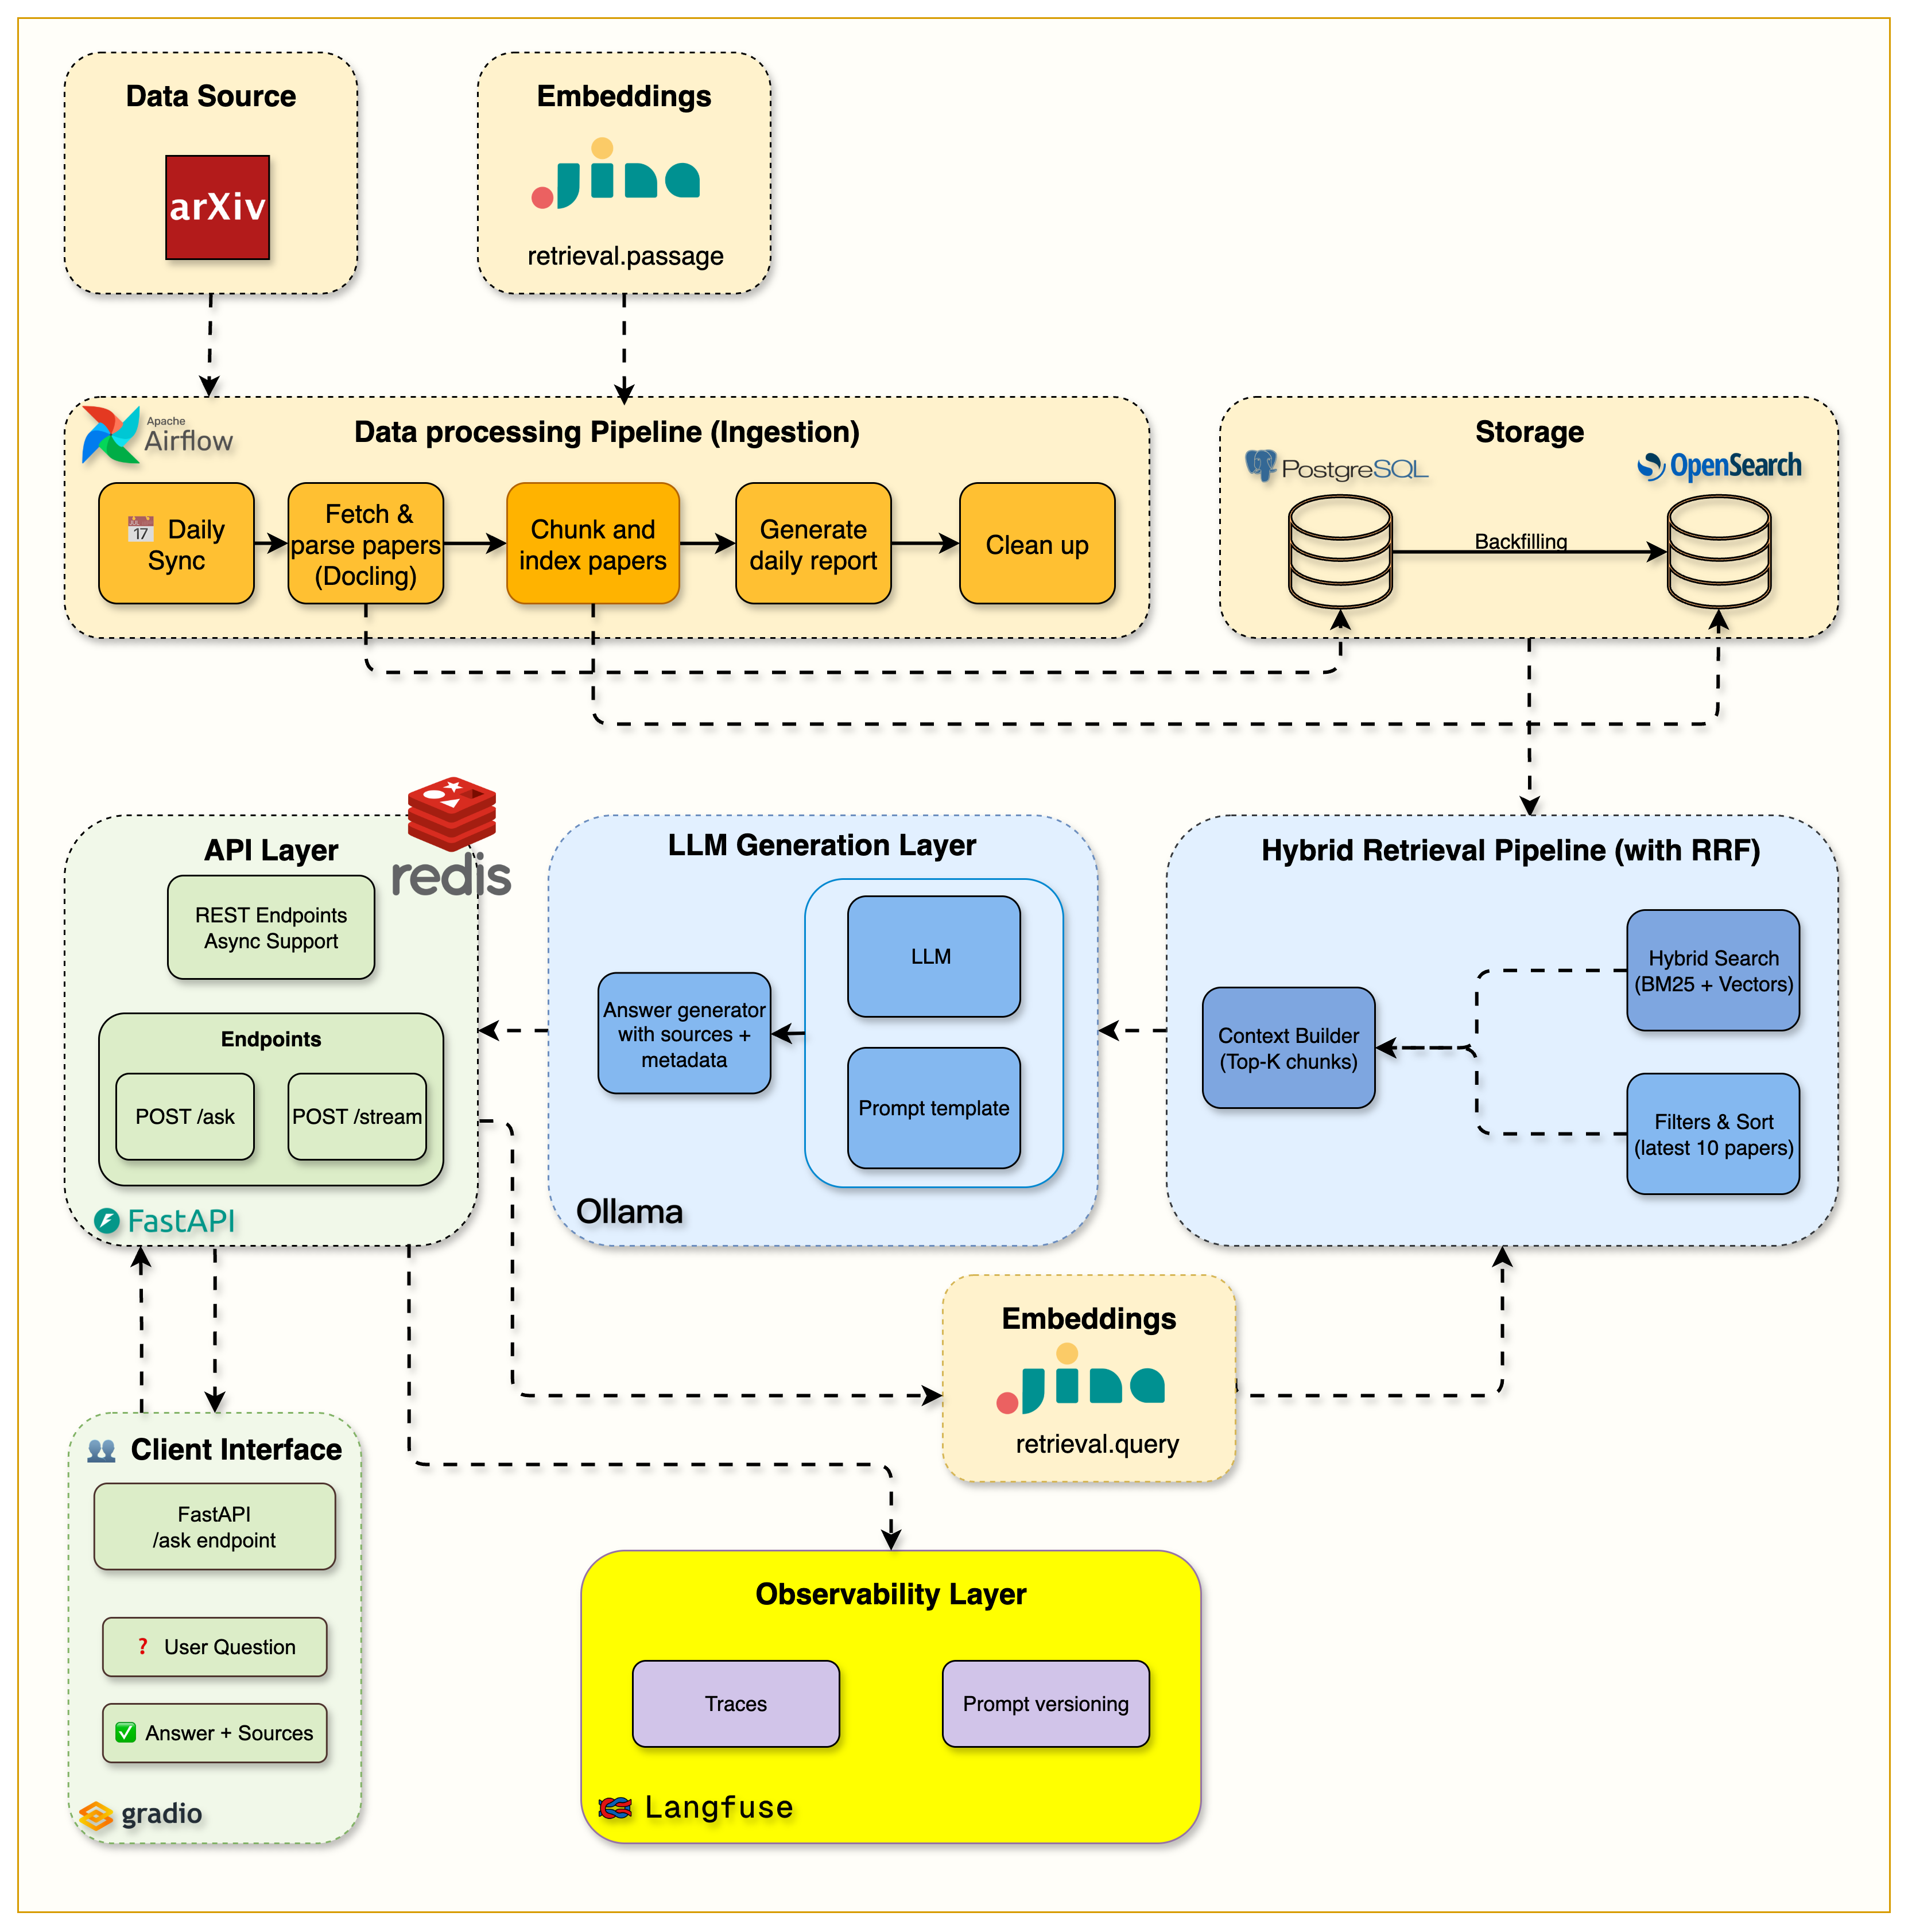
Complete production RAG system with Langfuse observability, Redis caching layer, and performance monitoring dashboards
Observability Layer: Langfuse tracking every step from query parsing to answer generation
Caching Strategy: Multi-level Redis cache for embeddings, search results, and complete responses
Performance Monitoring: Real-time dashboards showing latency, costs, and cache hit rates
Production Hardening: Health checks, circuit breakers, and graceful degradation
Getting Started
Before diving into Langfuse and caching setup, make sure all services are running:
# Start all containers including Redis
docker compose up --build -d

# Verify all services are healthy
docker compose psSetting Up Langfuse: Complete Walkthrough
Step 1: Access Local Langfuse
Navigate to http://localhost:3000
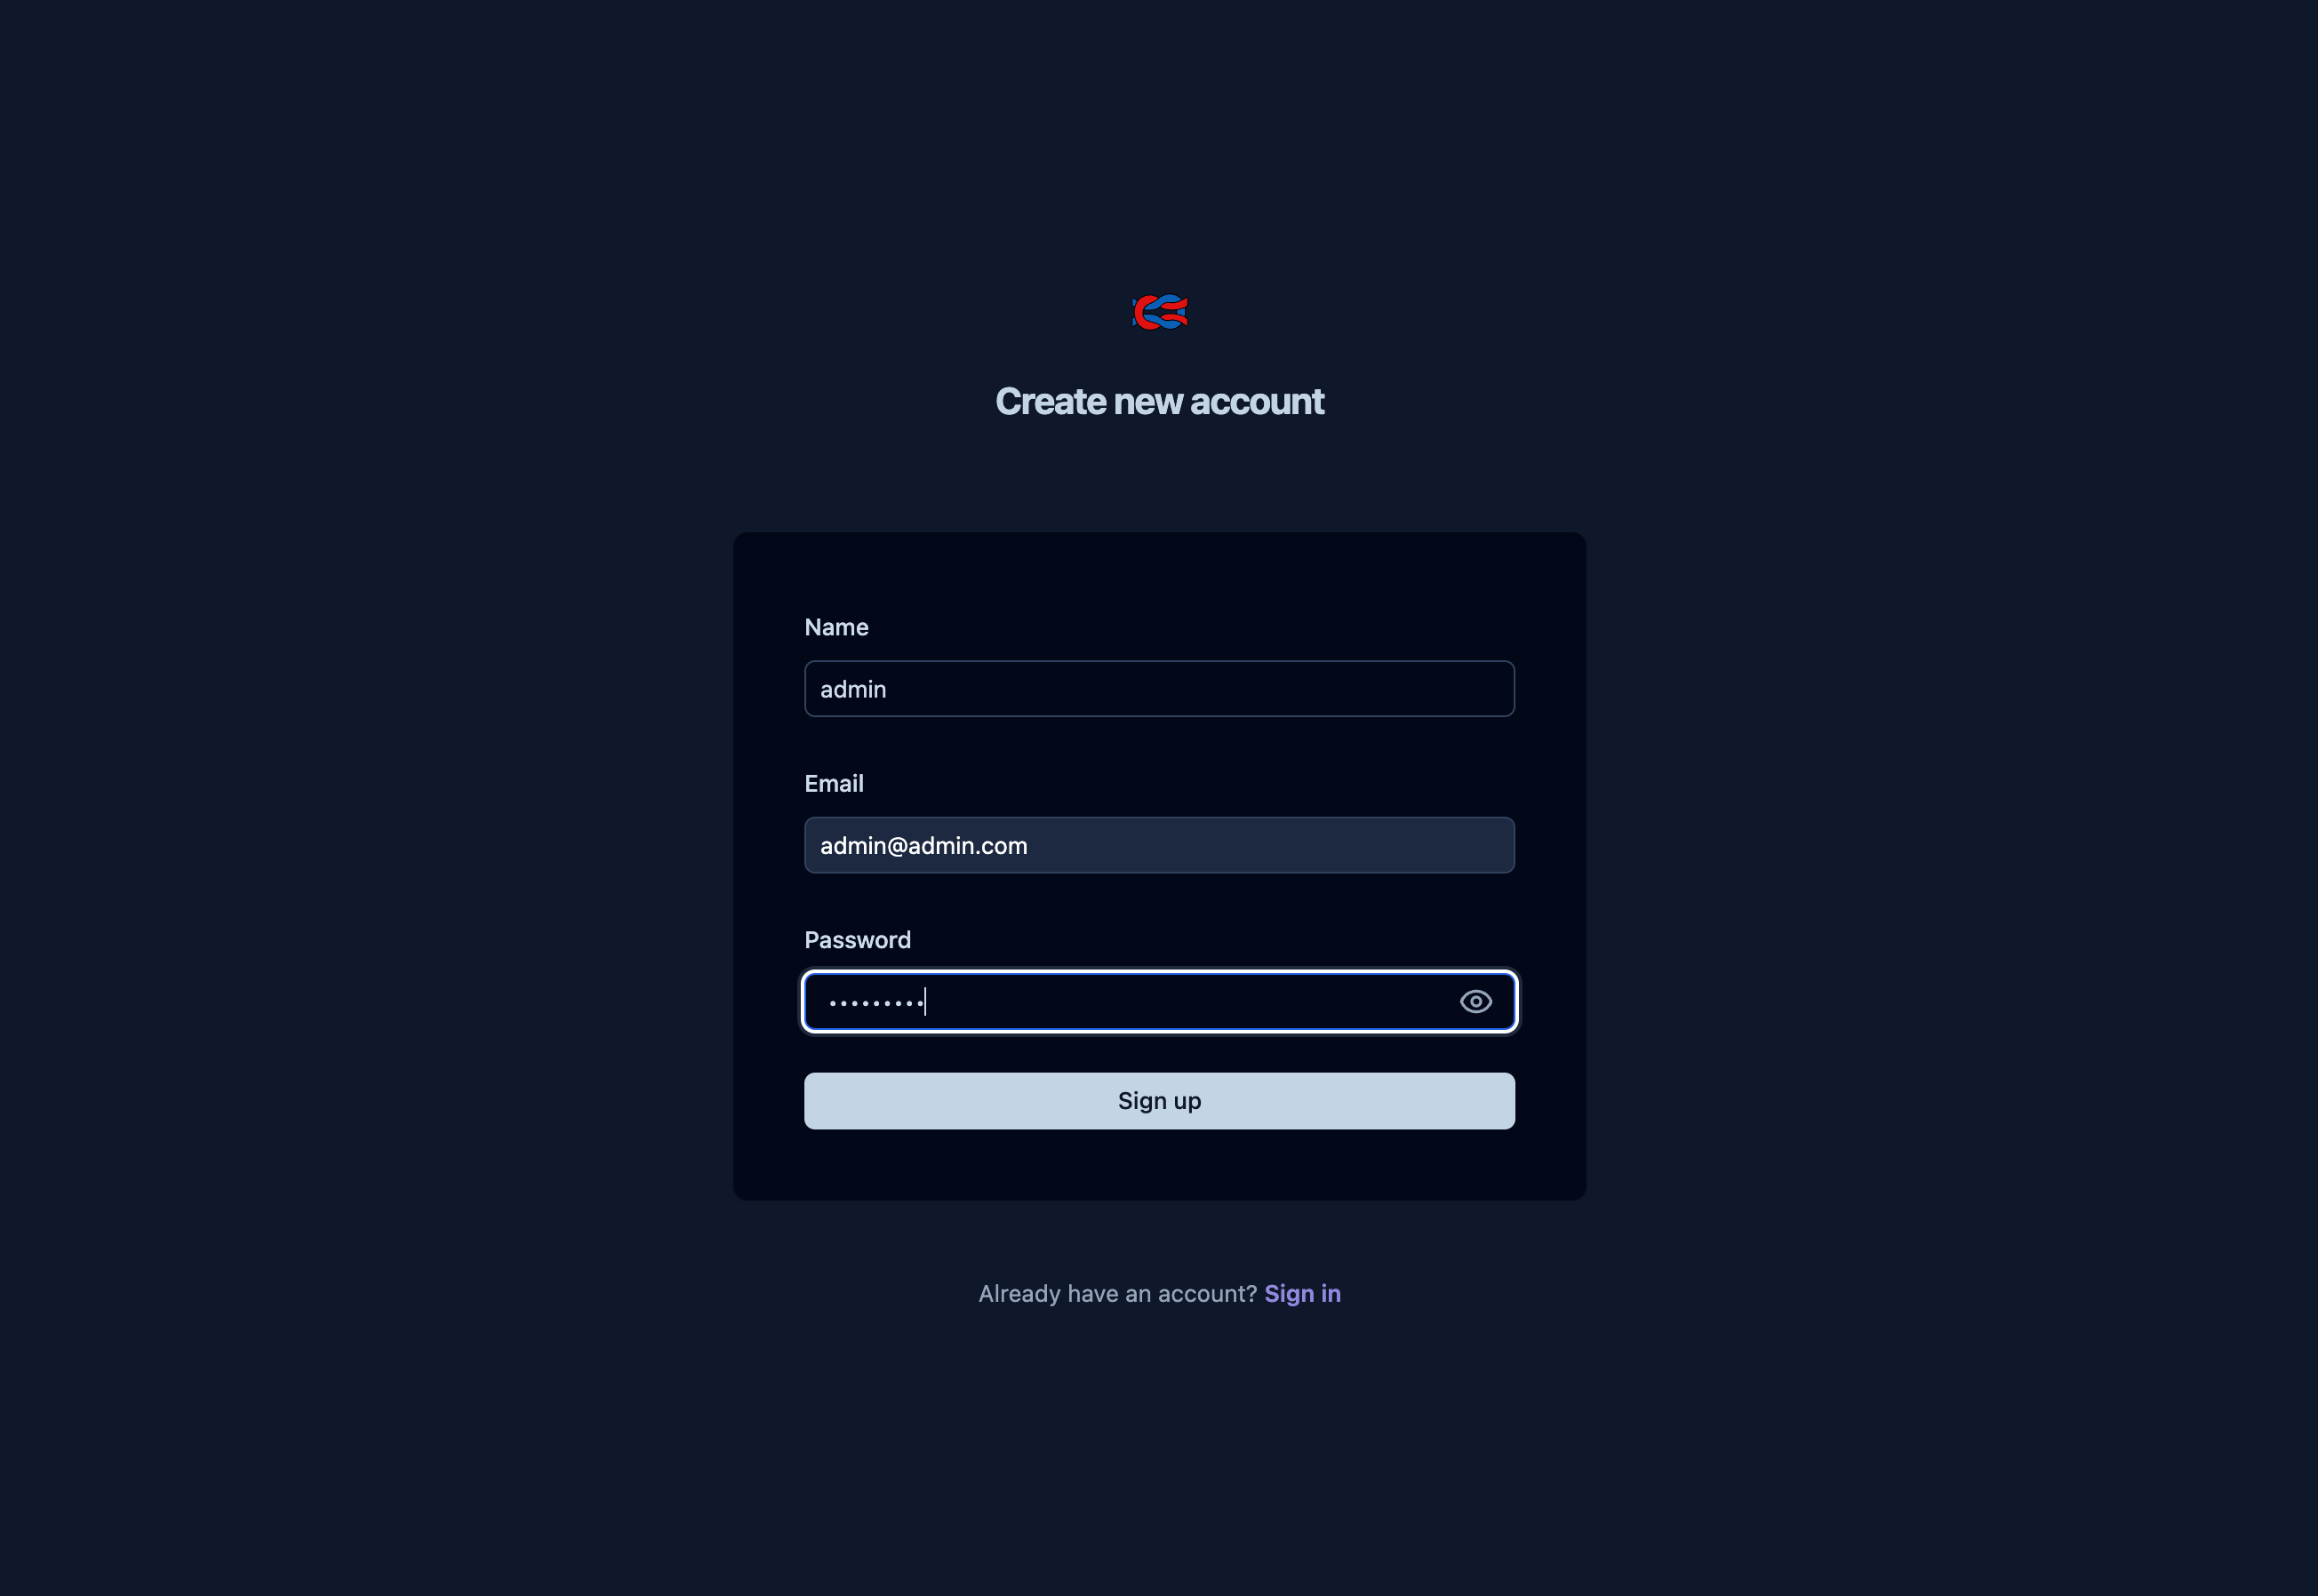
You'll see the local Langfuse interface, click on Sign Up.
Create an admin account
Step 2: Create Your First Project
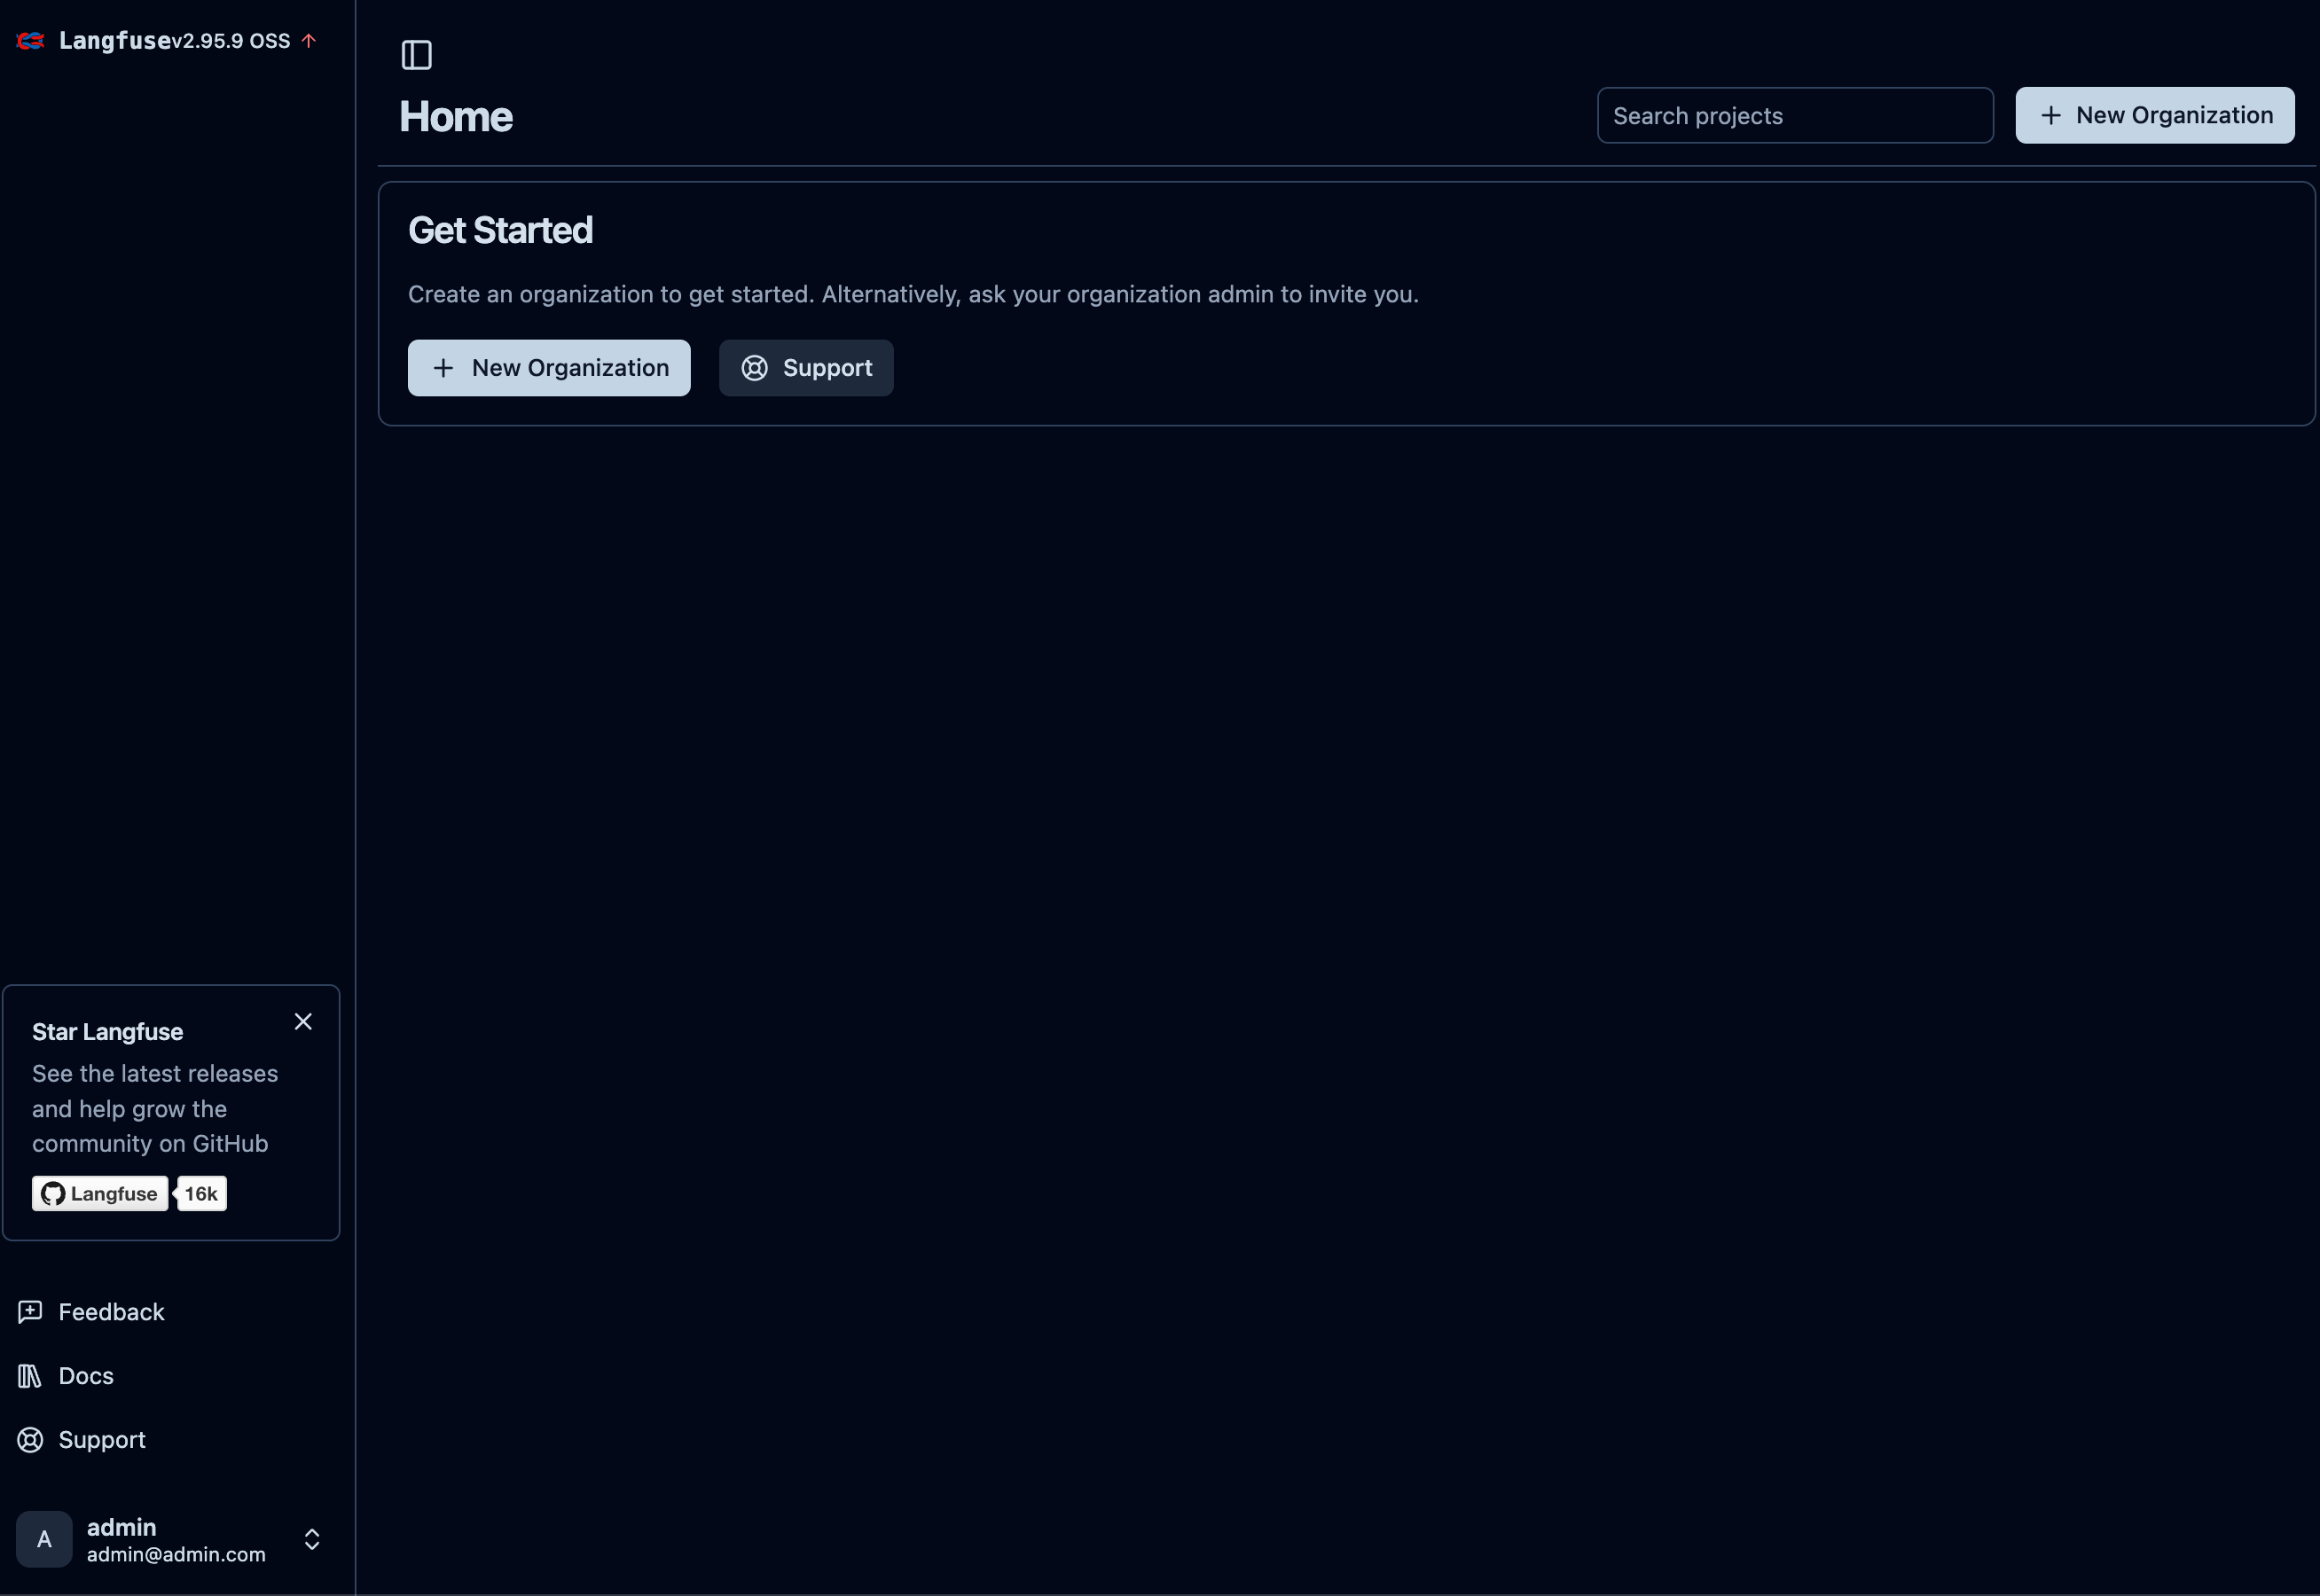
In the local interface, click "New Organization"
Name it "arxiv-paper-curator"
The project will be created locally.
Step 3: Get Your API Keys
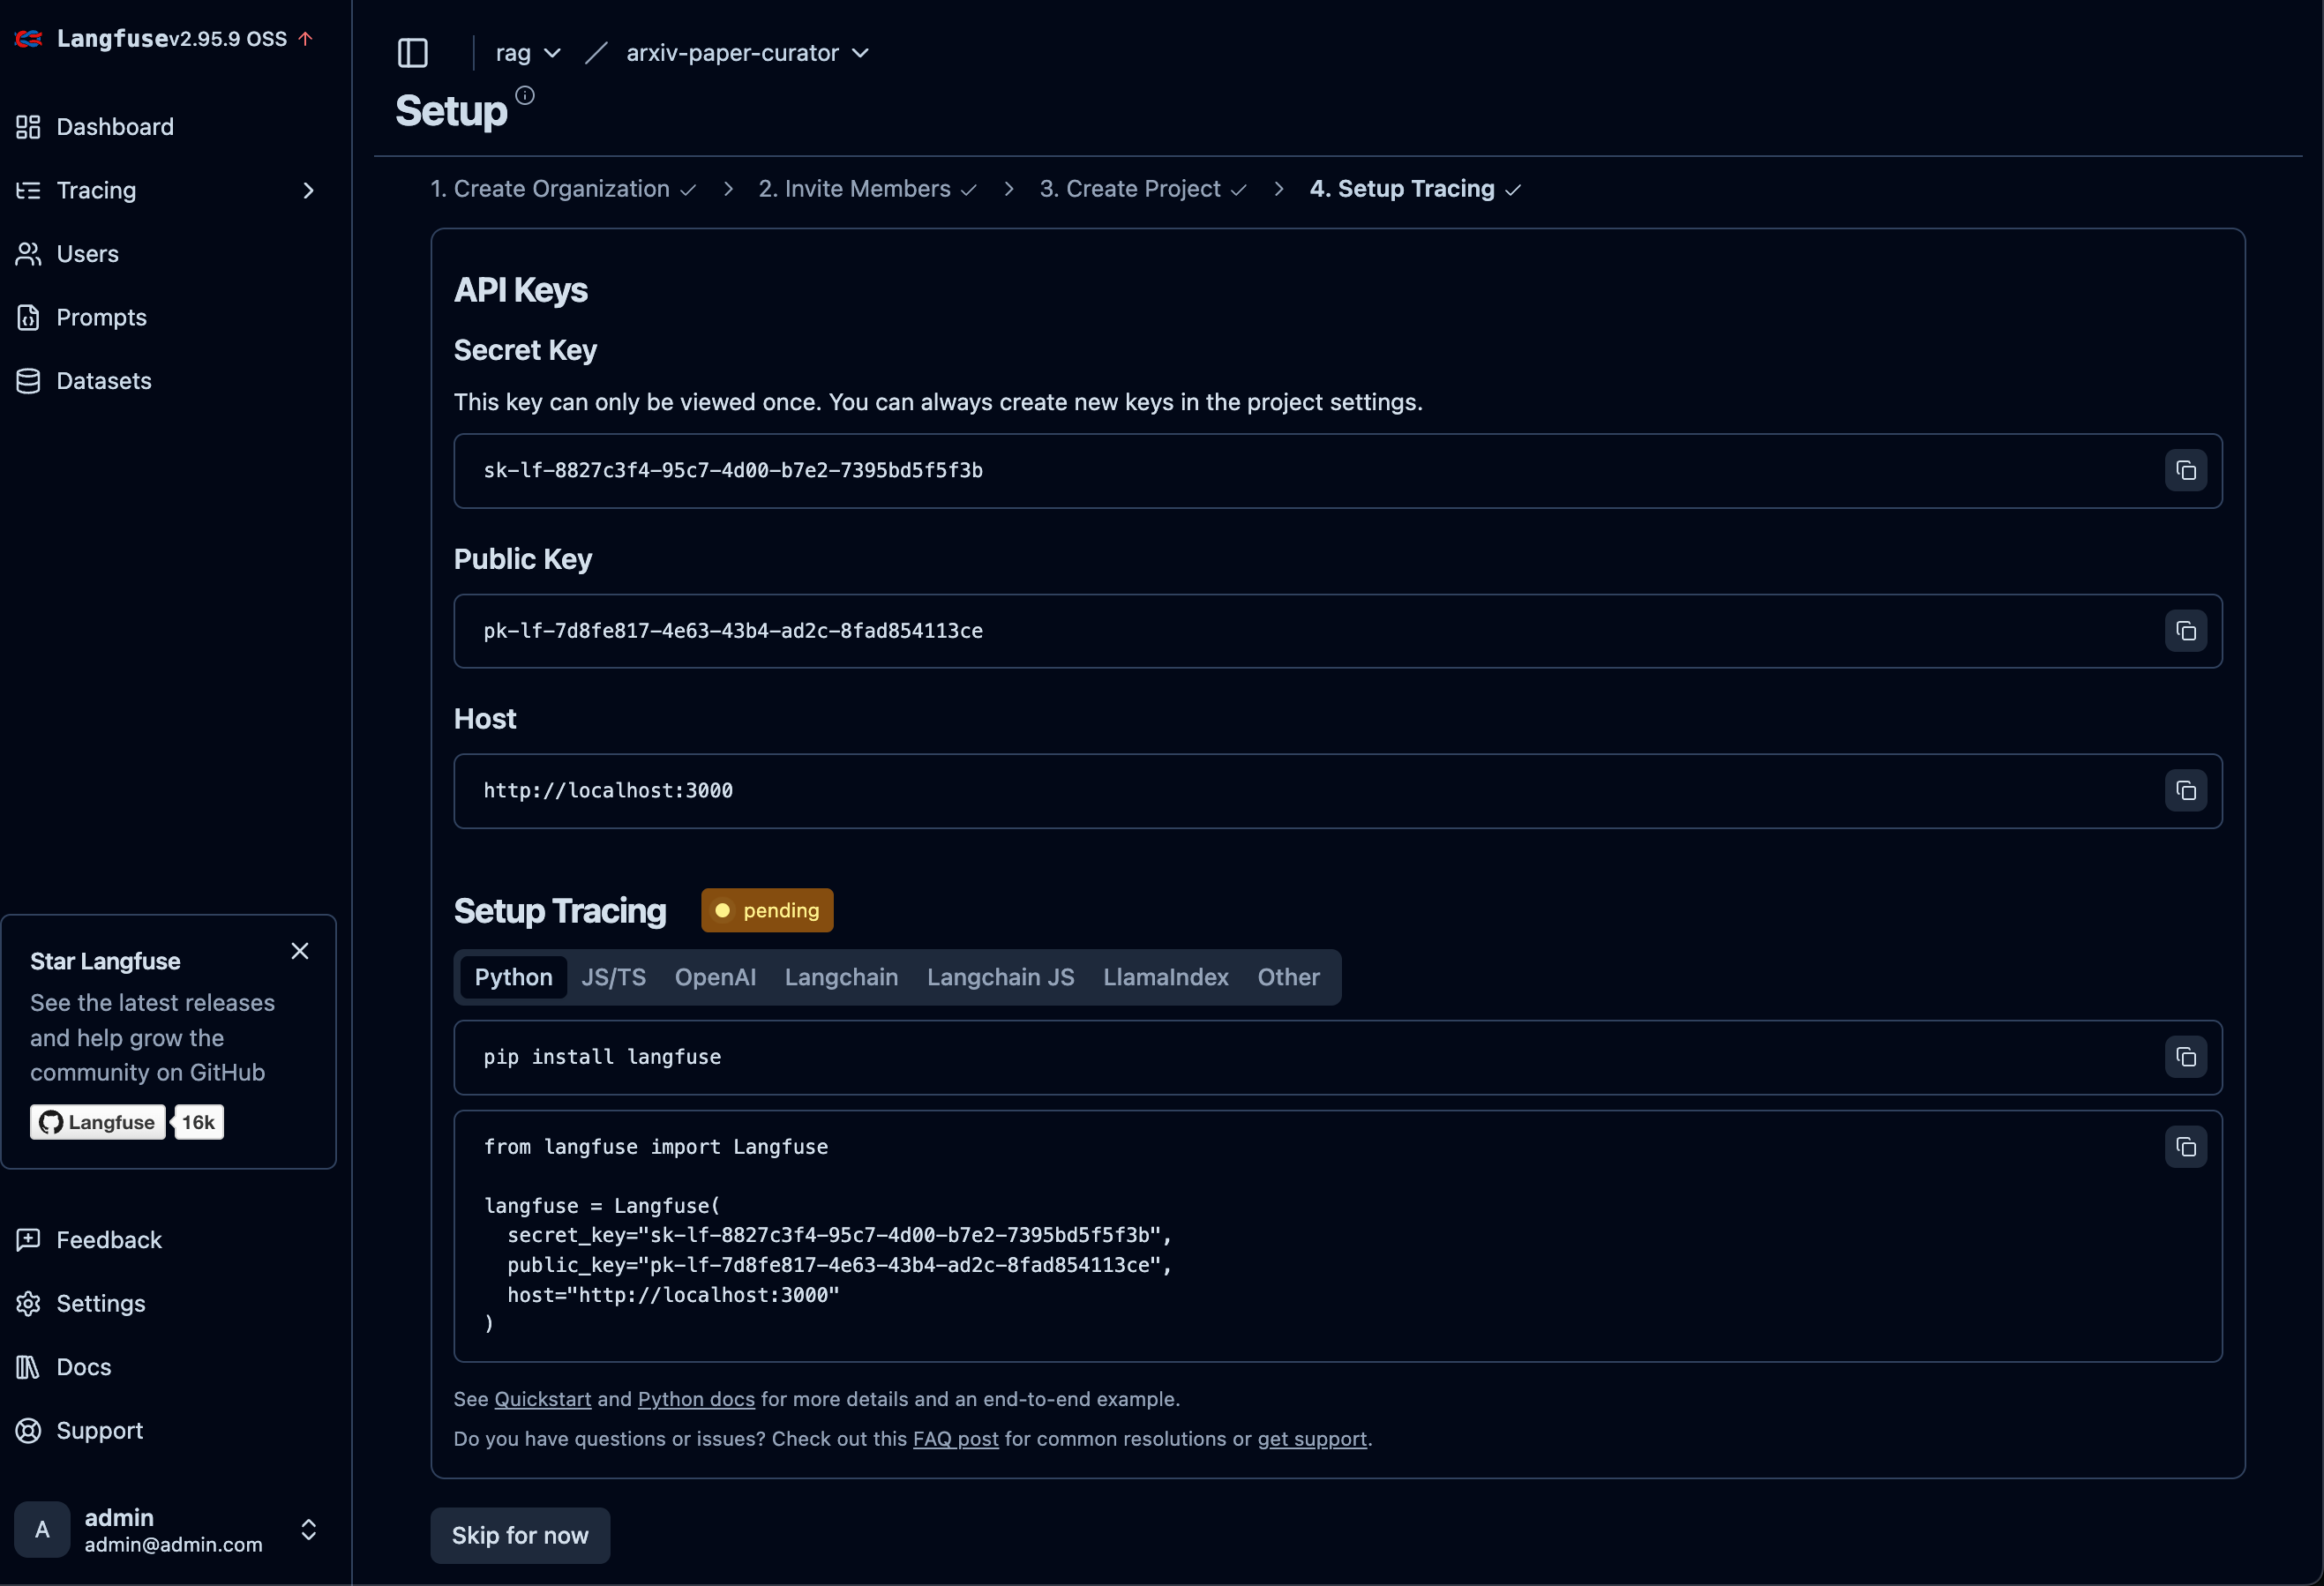
Navigate to Project Settings in the local interface
Find the "API Keys" section
Copy your:
Public Key:
pk-lf-...Secret Key:
sk-lf-...Host URL: http://localhost:3000
Step 4: Configure Environment Variables
Add these to your .env file:
# Langfuse Configuration
LANGFUSE__PUBLIC_KEY=pk-lf-your-public-key-here
LANGFUSE__SECRET_KEY=sk-lf-your-secret-key-here
LANGFUSE__HOST=http://localhost:3000
LANGFUSE__ENABLED=true
LANGFUSE__FLUSH_INTERVAL=1.0
Step 5: Integrate with Your Code
Langfuse tracing is already integrated throughout the RAG pipeline! Here's how it works in the existing code:
Automatic Tracing: Every RAG request is automatically traced with:
Request-level traces for the complete query journey
Embedding spans that time query embedding generation
Search spans that track retrieval performance and results
Generation spans that monitor LLM response creation
Key Integration Points:
src/services/langfuse/client.py
Main Langfuse client with connection managementsrc/services/langfuse/tracer.py
RAG-specific tracing utilitiessrc/routers/ask.py
API endpoints with integrated tracing
Once you configure the environment variables, tracing happens automatically for all requests. No additional code changes needed!
Step 6: Prepare the Environment
Before testing, ensure your environment is properly configured:
# Make sure Ollama has the required model pulled
docker exec rag-ollama ollama pull llama3.2:3b

# Restart the API container to pick up the new Langfuse environment variables
docker compose restart api

# Verify the API is healthy with new configuration
curl http://localhost:8000/api/v1/health
Step 7: Test with Gradio Interface
Now let's generate some traces by running queries through the Gradio interface:
uv run python gradio_launcher.pyOpen http://0.0.0.0:7861 in your browser
Try asking a few questions like:
"What are transformers in machine learning?"
"How does attention mechanism work?"
"Explain BERT architecture"
Each query will generate traces that you can view in Langfuse
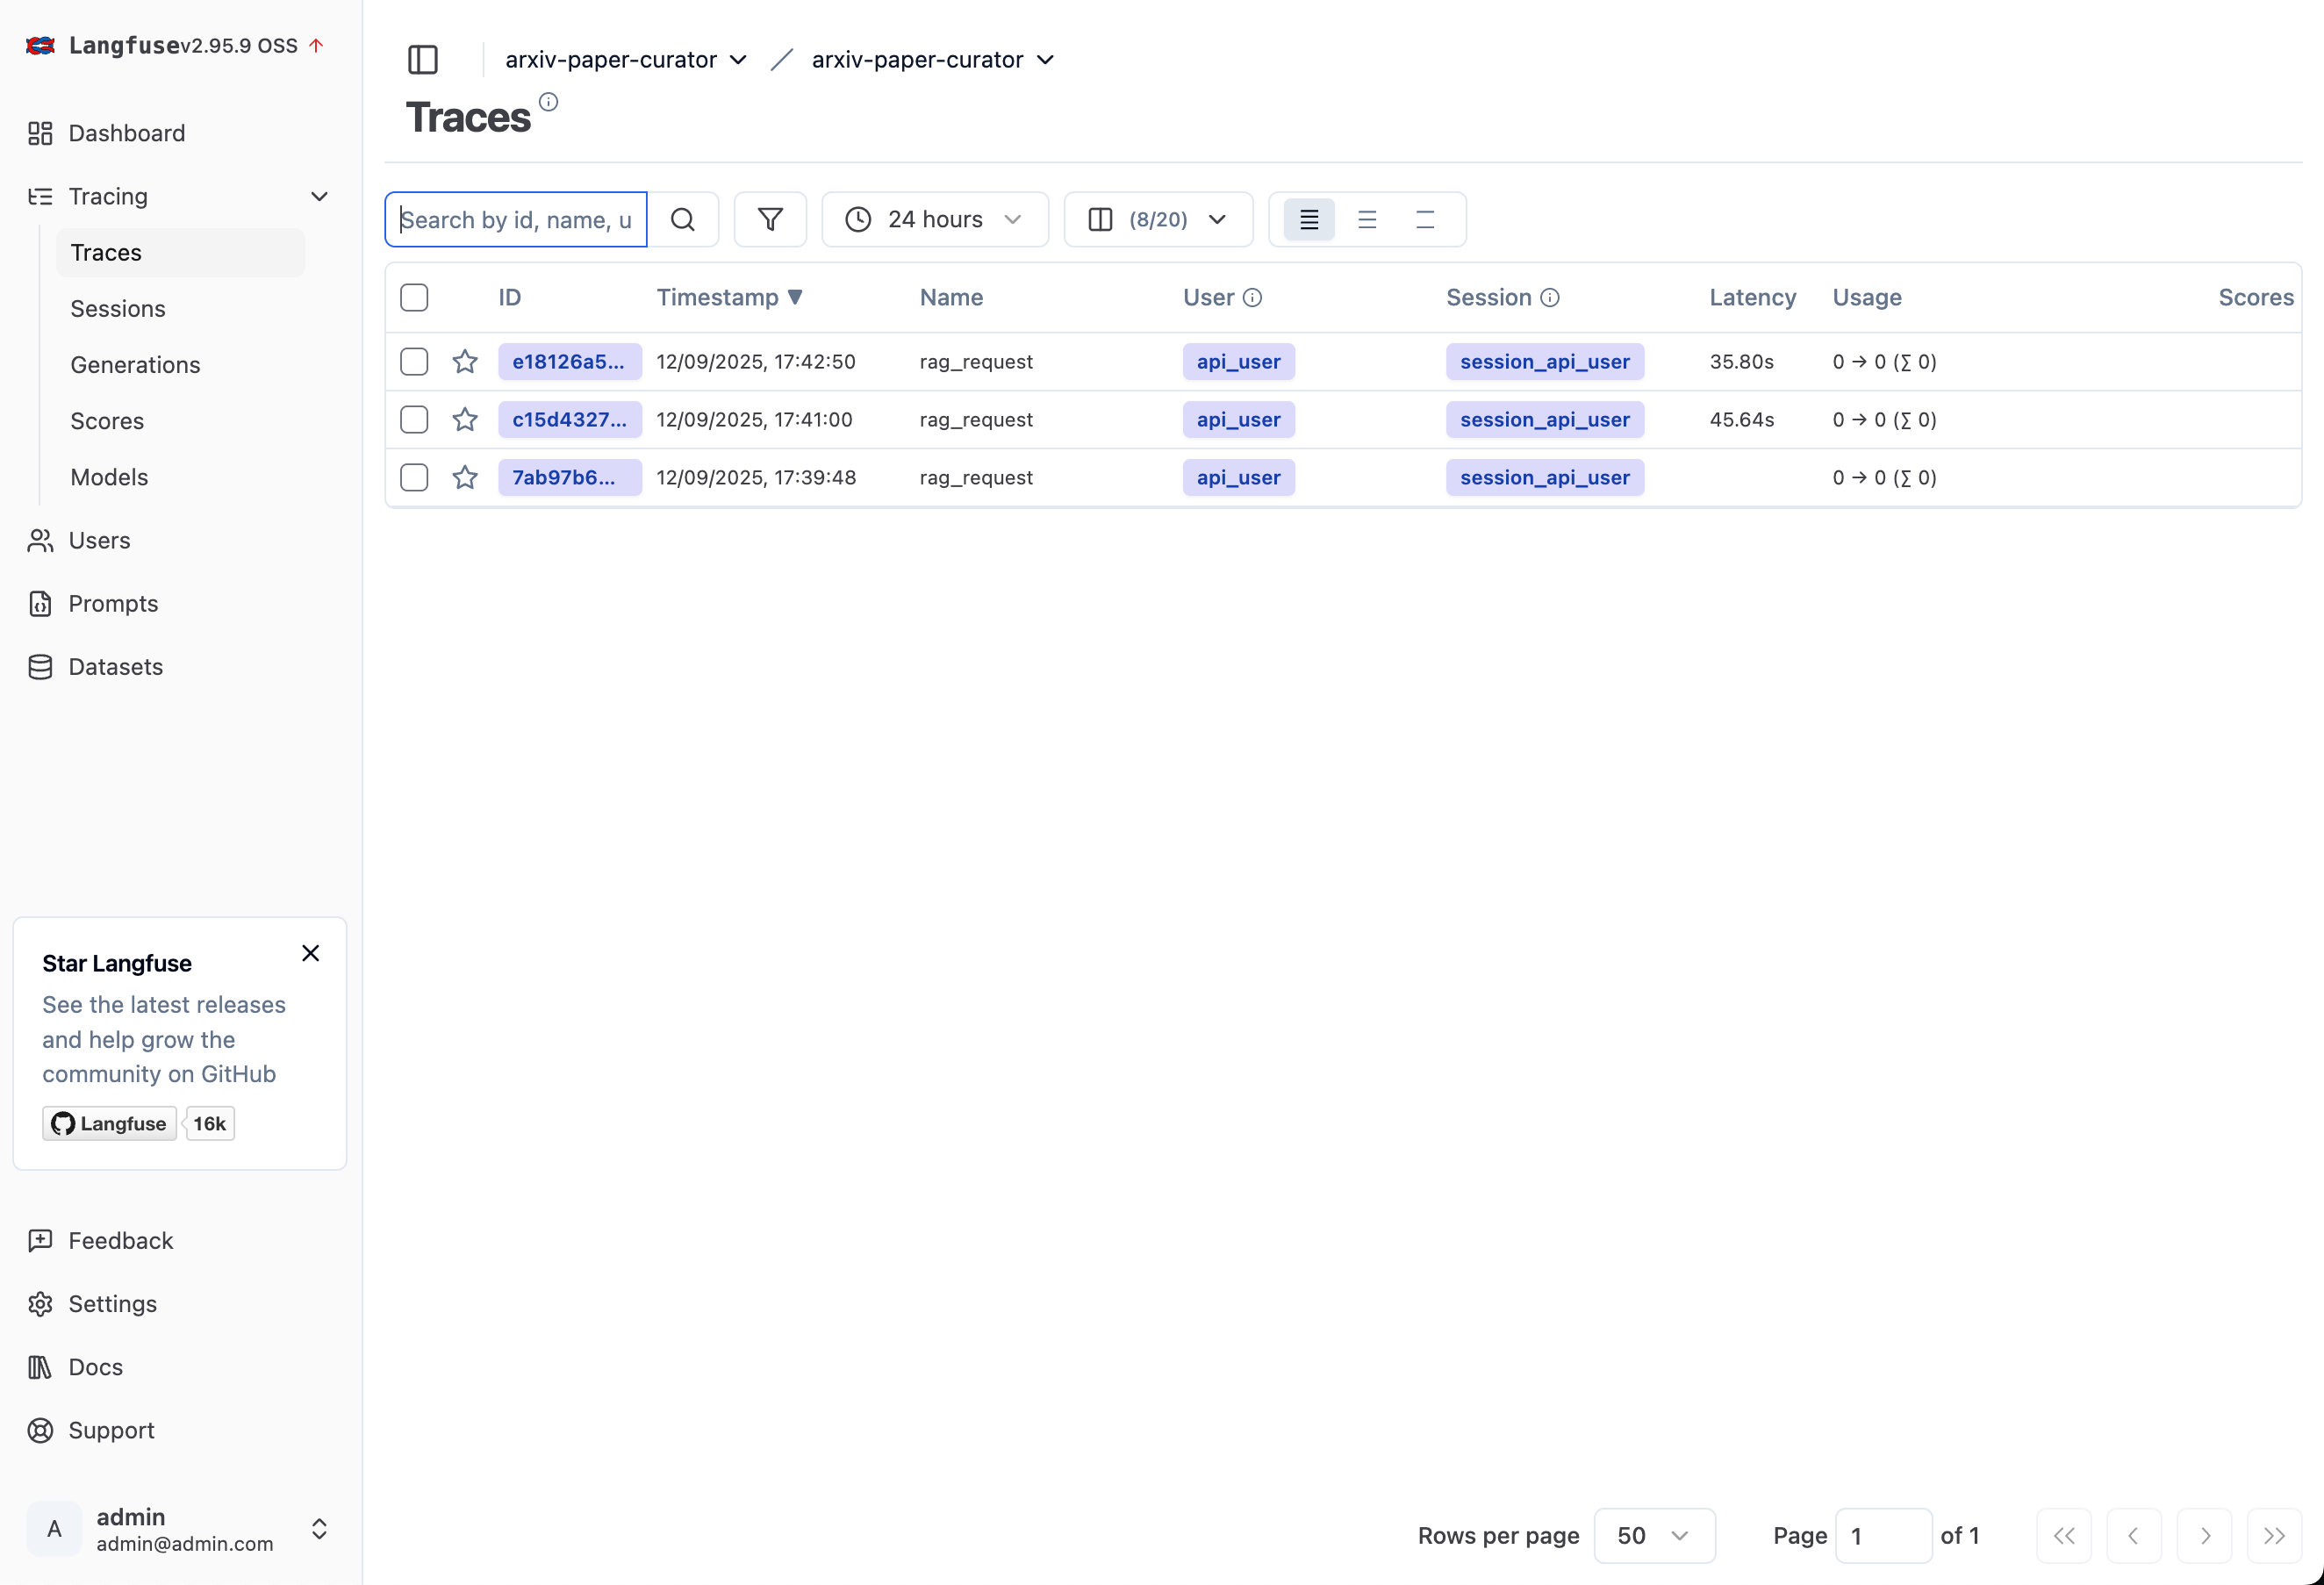
Step 8: View Your Traces
Main page:
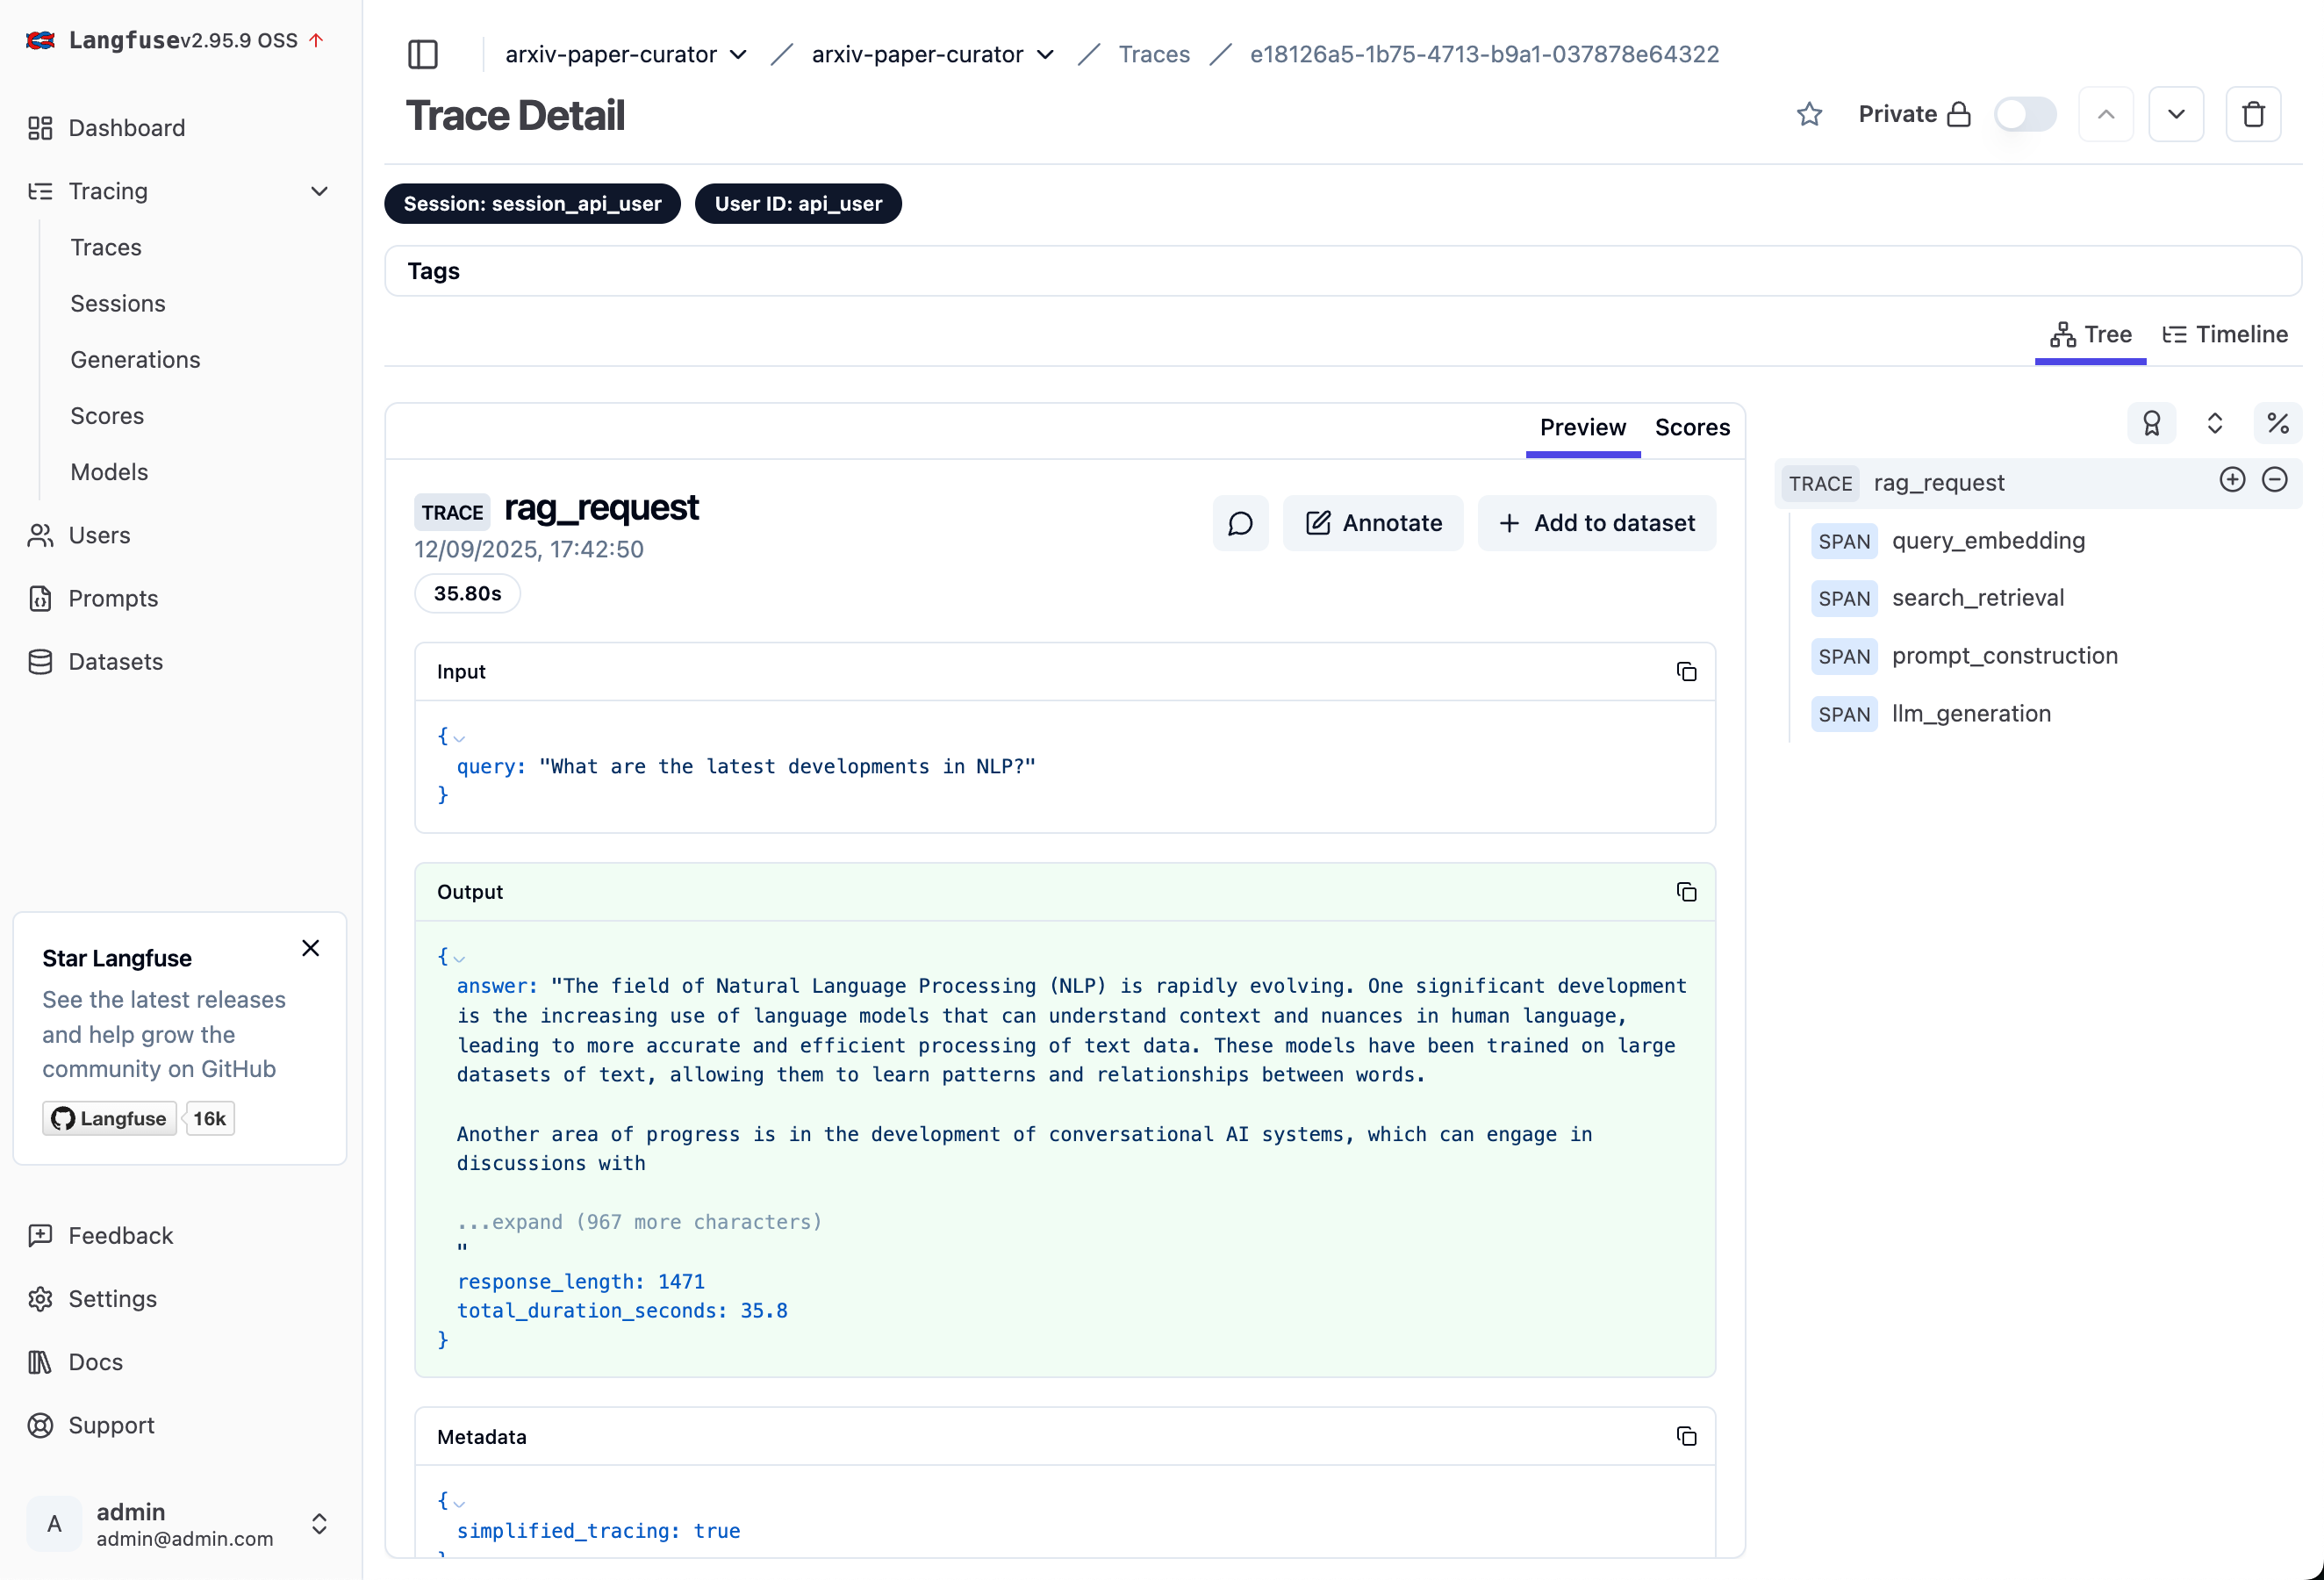
Particular request trace - all details can be seen in input and outputs!
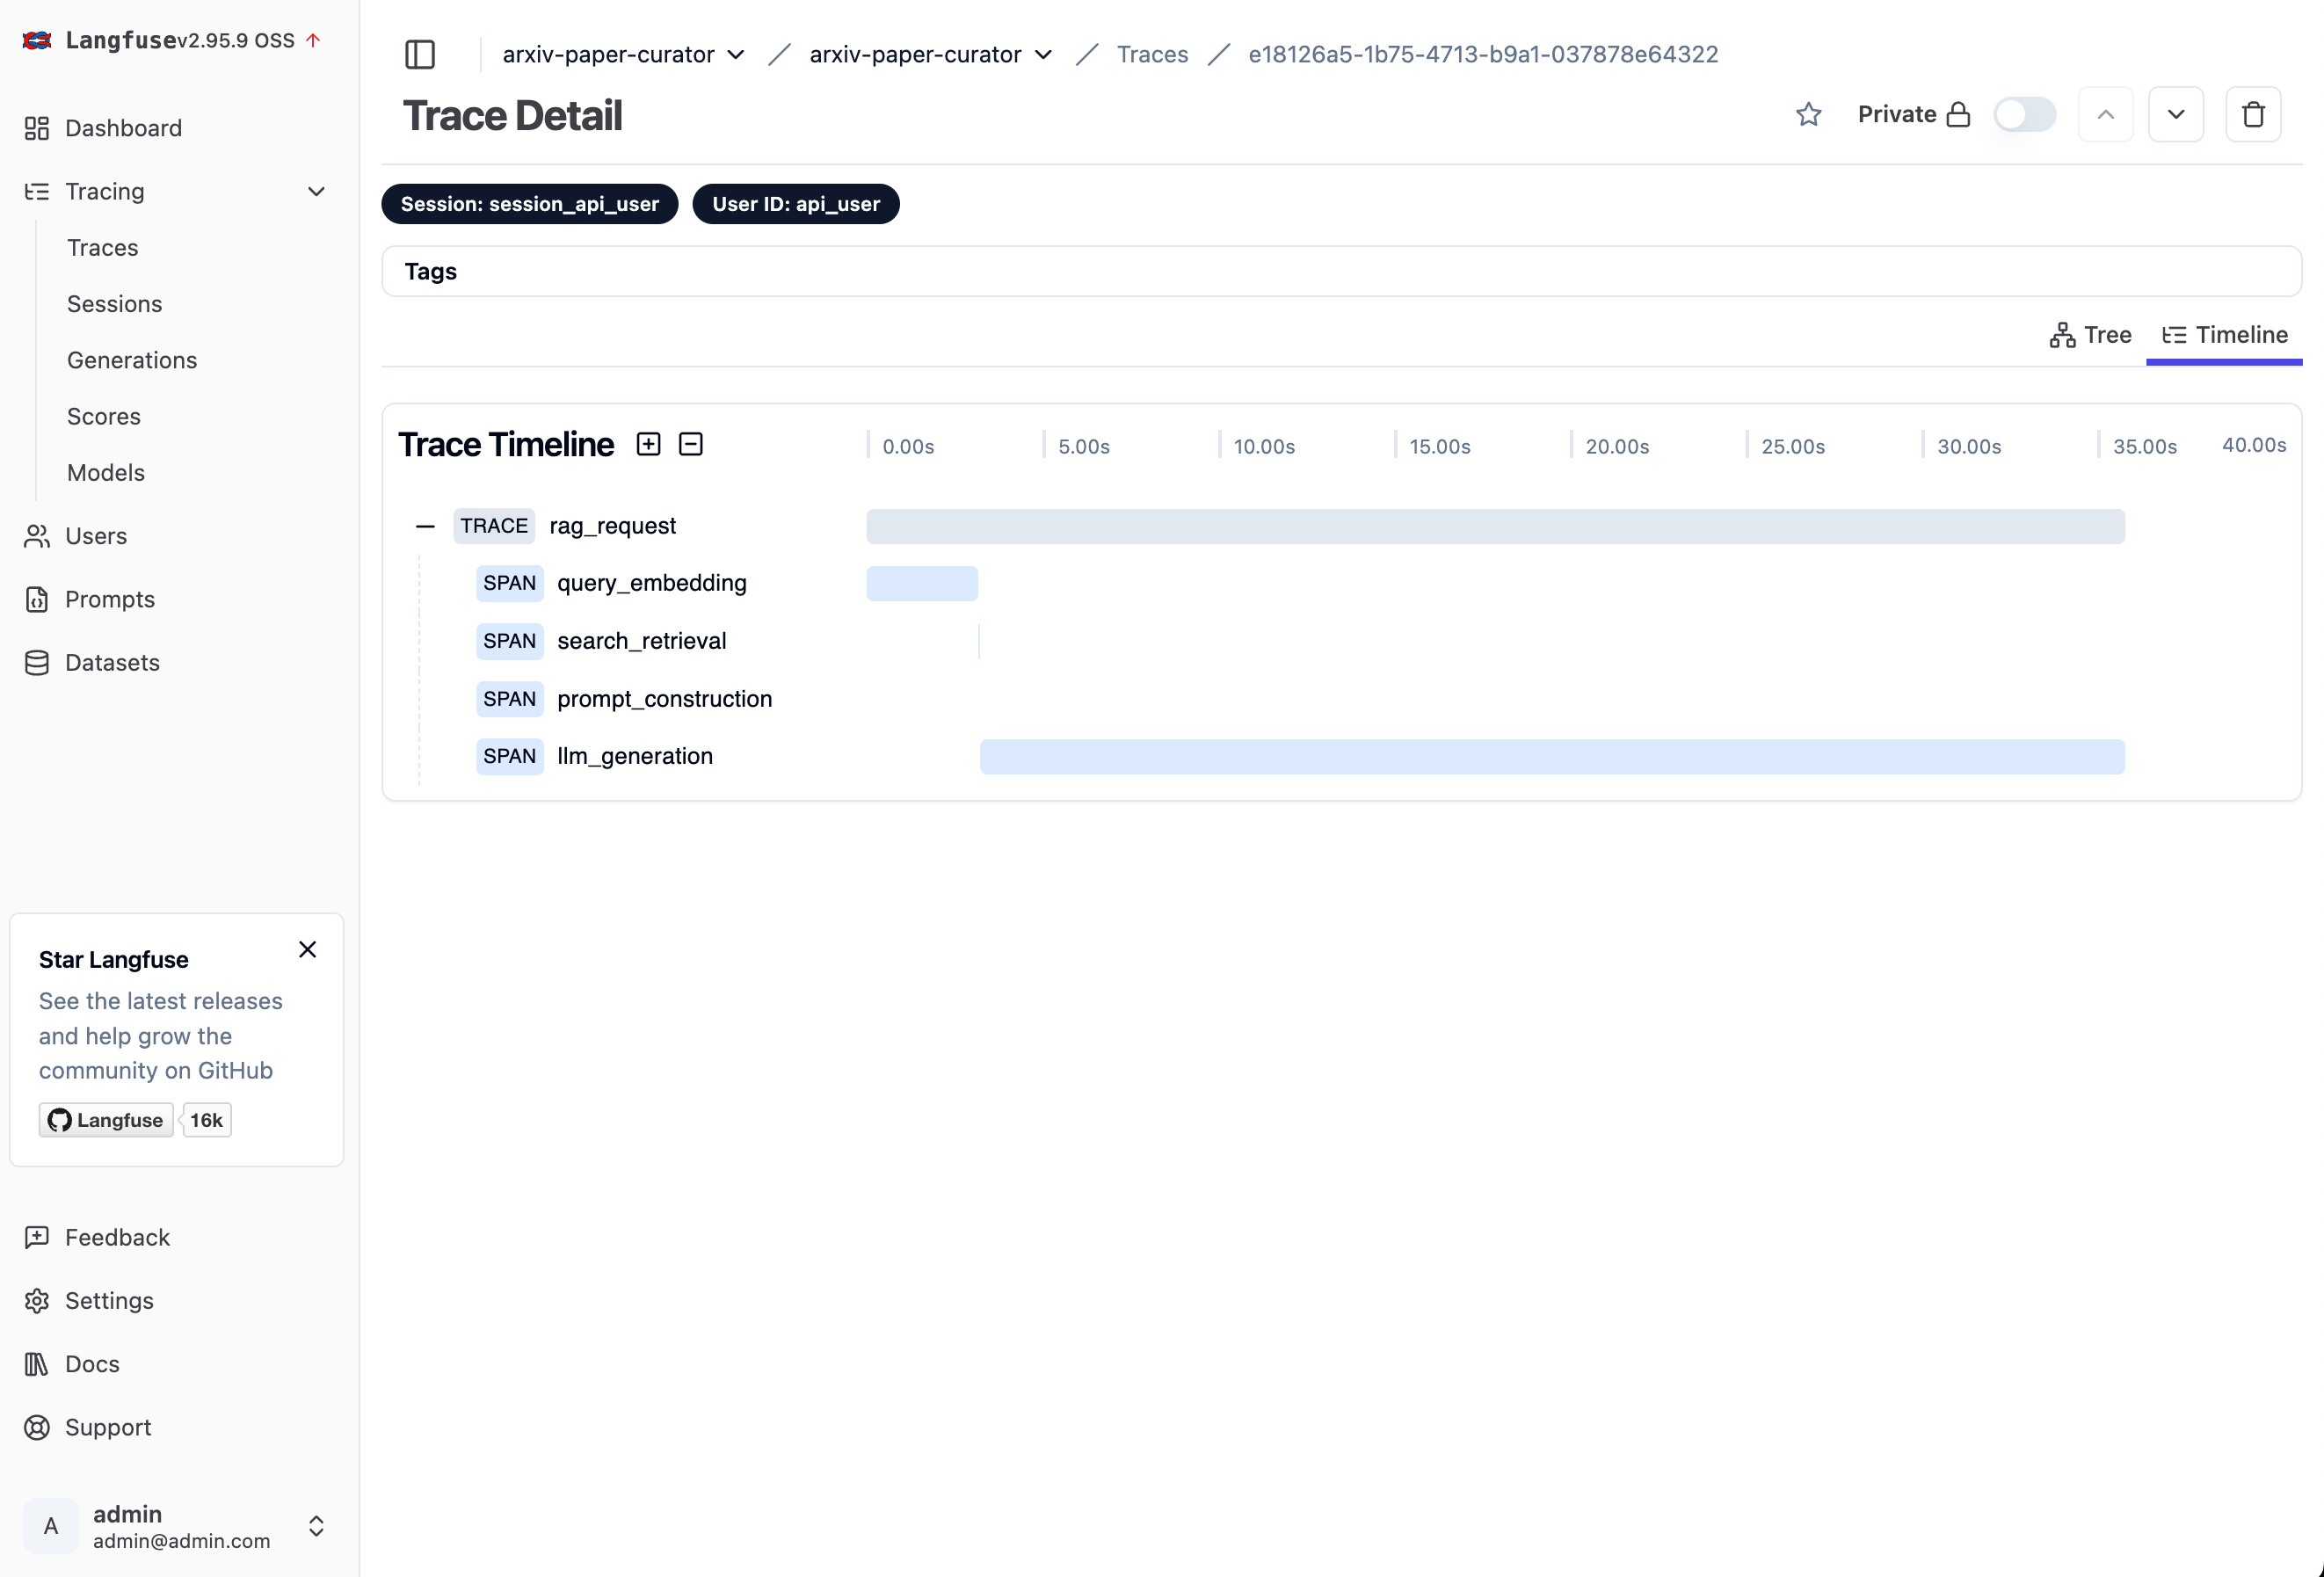
Timeline of each trace
Go to your local Langfuse dashboard at http://localhost:3000
Click on "Traces" in the sidebar
You'll see each RAG request with:
Query processing time
Retrieval latency and quality scores
LLM generation metrics
Total end-to-end latency
Feel free to explore around!
Step 9: Set Up Monitoring Dashboards
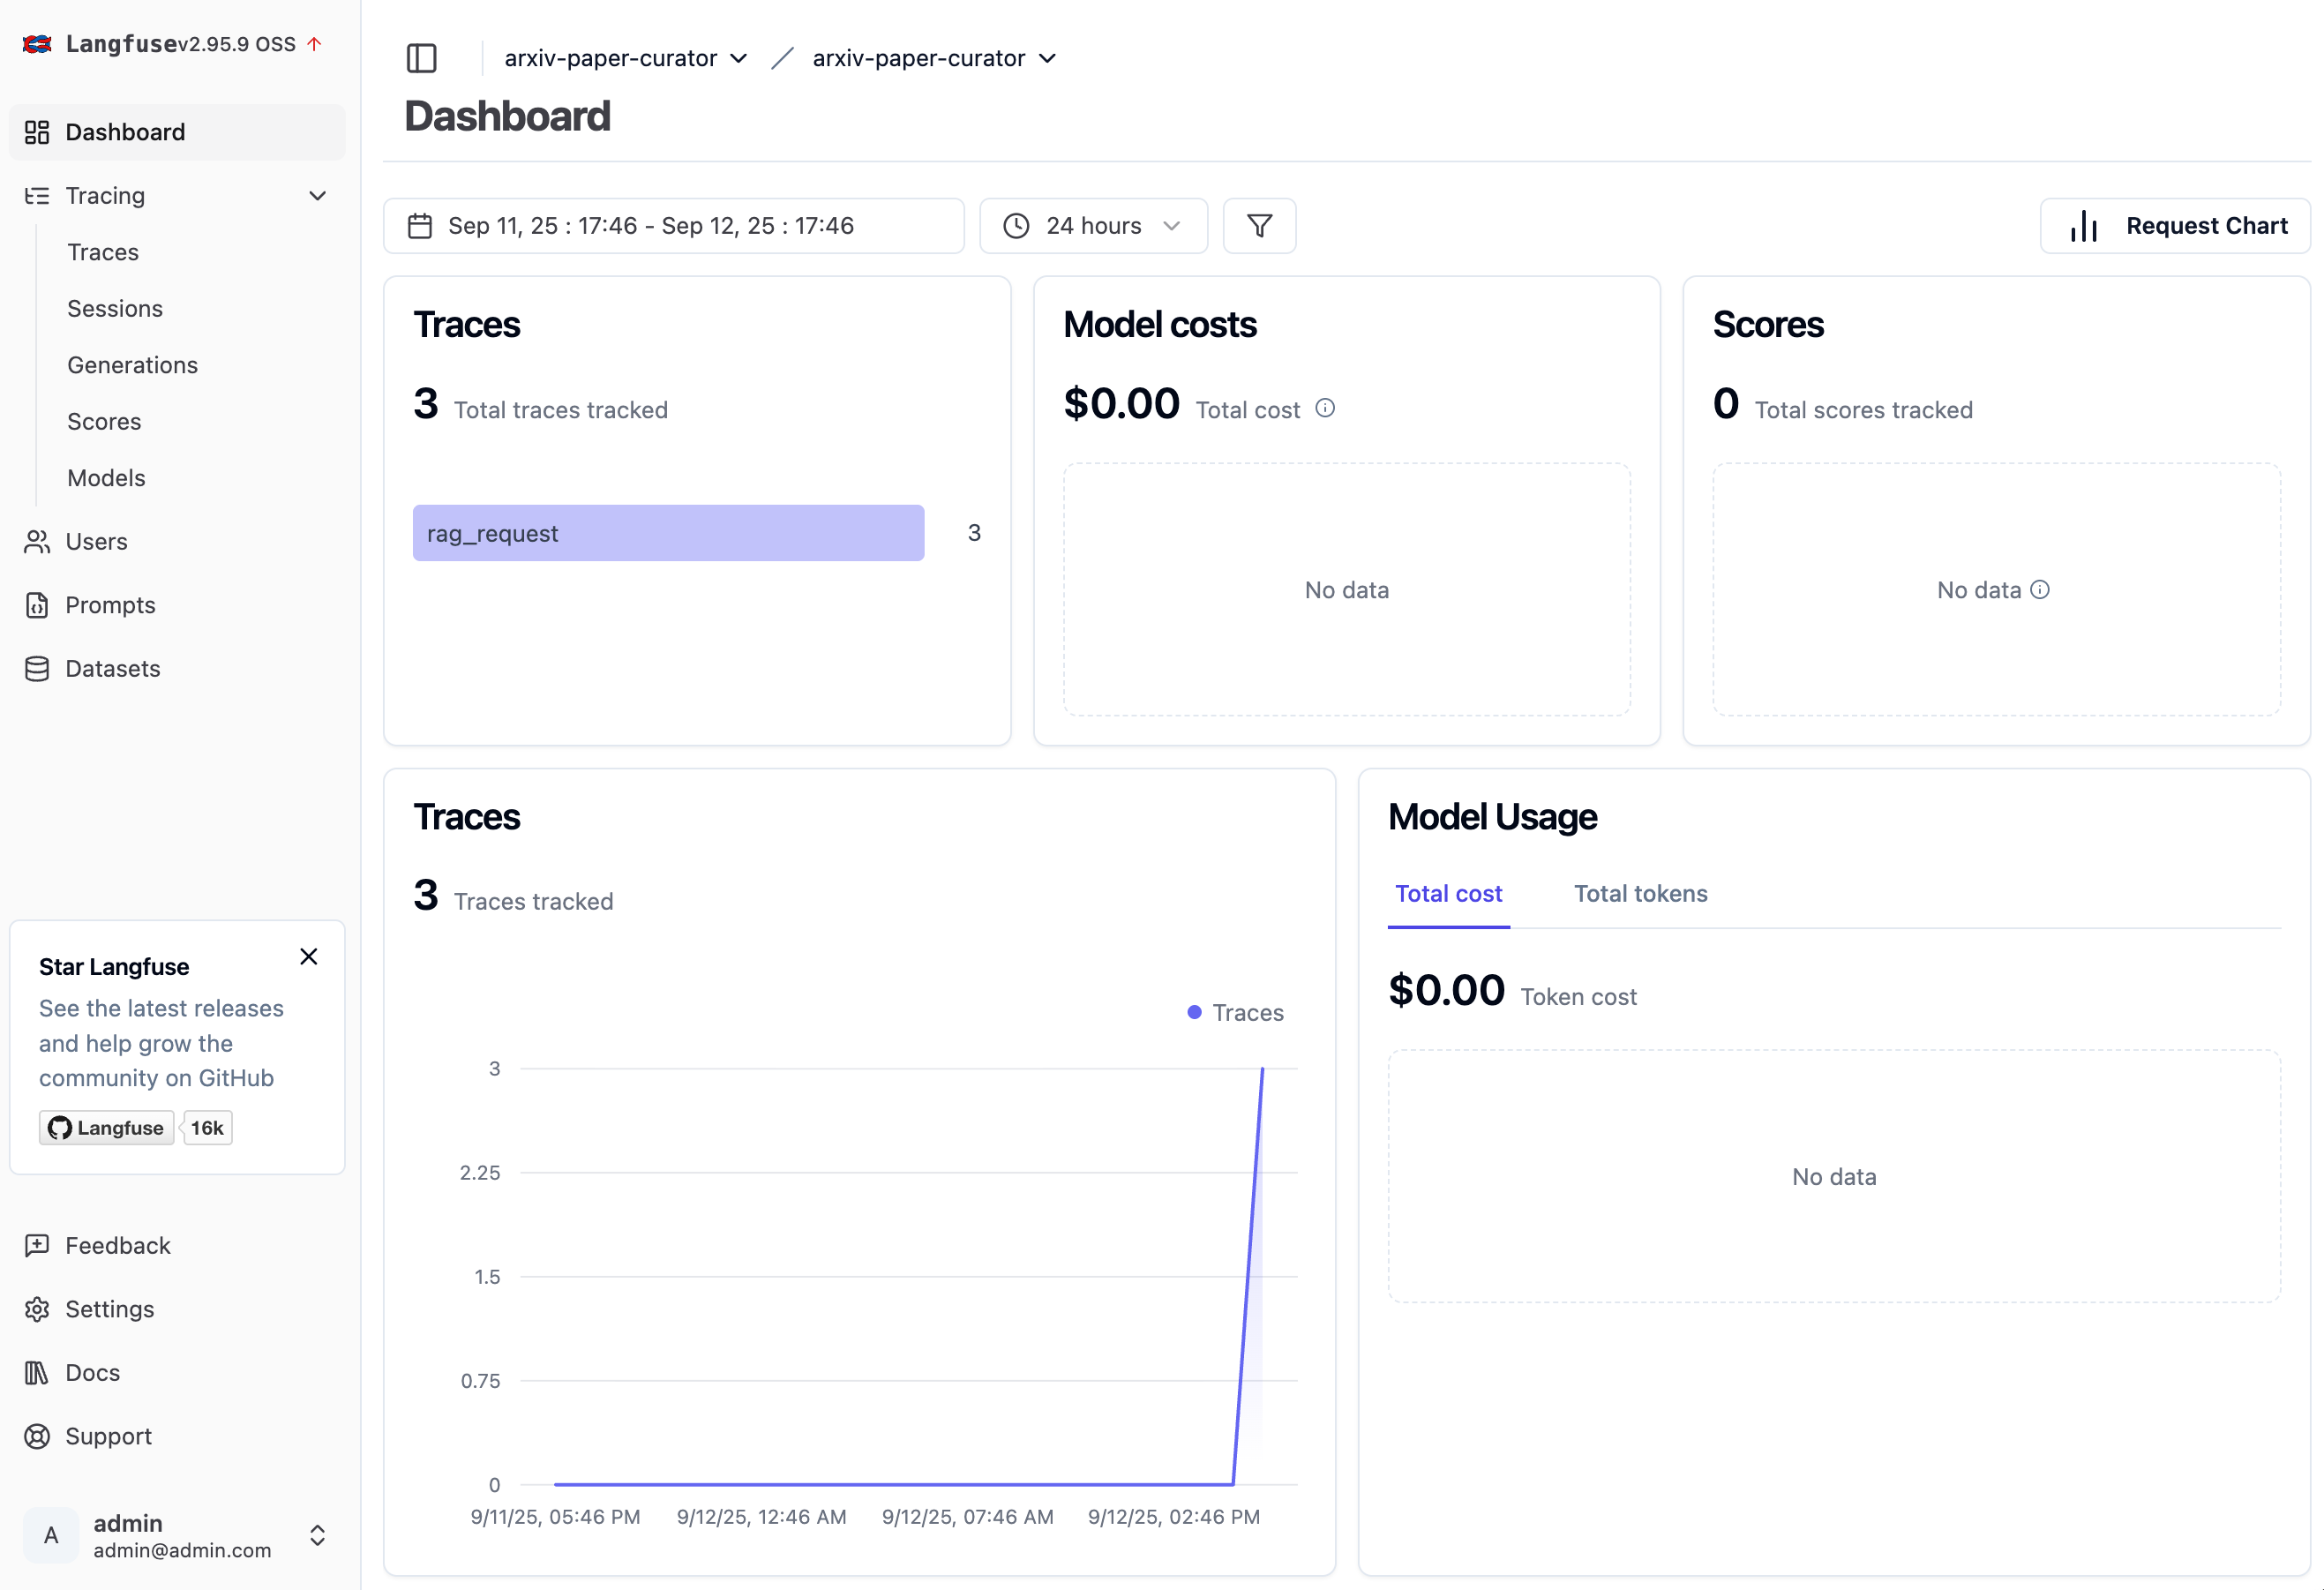
Navigate to "Dashboard" section
View built-in dashboards and add more widgets such as:
Average response time
Retrieval quality scores
Token usage and costs
Error rates and patterns
Implementing the Caching Layer
How Caching Works
Our caching implementation uses Redis for exact-match caching of RAG responses. The approach is straightforward:
Cache Key Generation: Each query combination (question + model + parameters) gets a unique SHA256 hash
TTL Management: Cached responses expire after 24 hours to ensure freshness
Graceful Fallback: If cache is unavailable, the system continues normally
Core Implementation
The cache client handles the basic operations:
# Simplified cache workflow
async def find_cached_response(request: AskRequest) -> Optional[AskResponse]:
    """Check if we have this exact query cached"""
    cache_key = generate_key(request.query, request.model, request.top_k)
    cached_response = redis.get(cache_key)

    if cached_response:
        return parse_response(cached_response)
    return None

async def store_response(request: AskRequest, response: AskResponse):
    """Store response with 24-hour TTL"""
    cache_key = generate_key(request.query, request.model, request.top_k)
    redis.set(cache_key, response.json(), ex=timedelta(hours=24))
Benefits of Caching
Speed: Cached responses return in ~50ms vs 3+ seconds for full pipeline
Cost Savings: Eliminates LLM calls for repeated queries (60%+ hit rate)
Reduced Load: Less strain on embedding services and search infrastructure
Better UX: Near-instant responses for common questions
Future: Semantic Caching
While we currently use exact-match caching, the foundation supports semantic caching where similar queries (even if worded differently) can share cache entries. This would use embedding similarity to find "close enough" queries and serve cached responses.
Example: "What are transformers?" and "Explain transformer architecture" could share the same cached response if they're semantically similar enough.
Code and Resources
📓 Code location: https://github.com/jamwithai/arxiv-paper-curator
📓 Interactive Tutorial: notebooks/week6/week6_cache_testing.ipynb
Complete Langfuse integration walkthrough
Cache performance analysis
Monitoring dashboard setup
Cost optimization strategies
📁 Key Files:
src/services/langfuse/client.py- Langfuse integration and tracingsrc/services/langfuse/tracer.py- RAG-specific tracing utilitiessrc/services/cache/client.py- Redis cache implementationsrc/routers/ask.py- Updated with caching and tracing integrationdocker-compose.yml- Updated with Redis service
📚 Documentation:
Week 6 README:
notebooks/week6/README.mdLangfuse Dashboard: http://localhost:3000
Previous weeks:
Week 2: Bringing Your RAG System to Life
Week 5: The Complete RAG System
Verifying Everything Works
Prerequisites:
Start all services including Redis:
docker compose down -v  # Clean start
docker compose up --build -d
Verify Redis connection:
docker exec rag-redis redis-cli ping
# Should return: PONG
Configure Langfuse:
Add your Langfuse API keys to
.envVerify connection:
curl http://localhost:3000/api/public/health
Testing the Implementation
Want to see monitoring and caching in action? Three ways to test:
1. API Testing with Cache Metrics
# First request (cache miss)
time curl -X POST "http://localhost:8000/api/v1/ask" \
  -H "Content-Type: application/json" \
  -d '{"query": "What are transformers in machine learning?", "top_k": 3}'

# Second identical request (cache hit - should be instant)
time curl -X POST "http://localhost:8000/api/v1/ask" \
  -H "Content-Type: application/json" \
  -d '{"query": "What are transformers in machine learning?", "top_k": 3}'
2. Langfuse Trace Viewer
Make several RAG queries through the API or Gradio
Open your Langfuse dashboard
Compare traces for cached vs non-cached requests
Observe the latency differences and cache hit indicators
3. Interactive Monitoring Notebook
uv run jupyter notebook notebooks/week6/week6_cache_testing.ipynbThe notebook includes:
Real-time cache hit rate analysis
Langfuse trace exploration (mostly covered here)
Summary
This week we transformed our RAG system from functional to production-ready:
✅ Langfuse integration provides complete visibility into every query
✅ Redis caching delivers instant responses for same queries
✅ Performance monitoring reveals optimization opportunities
The compound effect: By adding observability and caching to our solid foundation, we've created a RAG system that's not just powerful but efficient, observable, and ready for real-world deployment.
Follow Along:
This concludes Phase 1 of our Zero to RAG series, but we're just getting started! The extended series will dive deep into advanced techniques, making this the most comprehensive RAG resource available.
What's Next: The Extended RAG Journey
We've completed the foundational Zero to RAG series, but this is just the beginning!
Our vision is to create ONE Complete RAG learning resource covering advanced retrieval (ColPali, ColBERT), evaluation frameworks (RAGAS, LLM-as-judge), agentic RAG with multi-step reasoning, production excellence (cloud deployment, monitoring), and cutting-edge techniques (Graph RAG, Self-RAG, HyDE).
Every technique, every optimization, every production consideration - all with working code and interactive notebooks.
The Vision: ONE Complete RAG Resource
If you're interested in this extended series, share and comment "interested" and we'll continue building the most comprehensive RAG resource available!
Let's continue building together! 💪
interested
Interested